Dashboard
The processes dashboard of Cockpit is the entry point for process monitoring. It comes with a pre-installed plugin, which lets you see deployed process definitions. Additional plugins can be added to the processes dashboard.
Deployed Processes
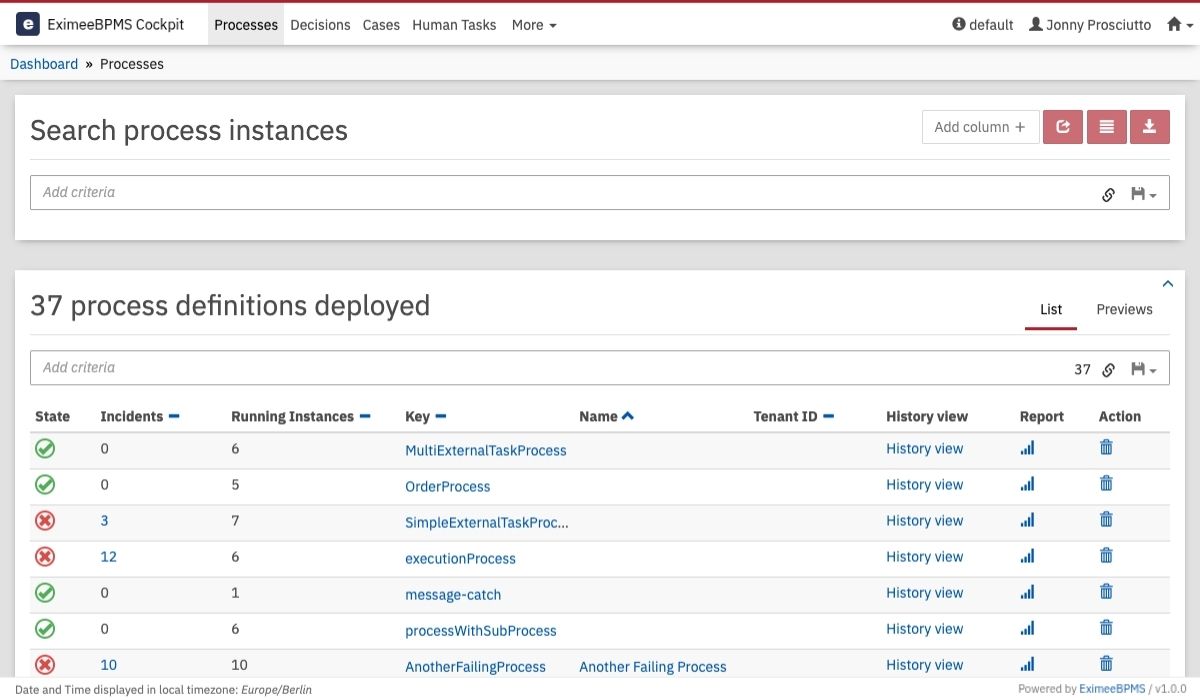
With this plugin you can easily observe the state of a process definition. Green and red dots signalize running and failed jobs. At this observing level a red dot signifies that there is at least one process instance or a sub process instance which has an unresolved incident. You can localize the problem by using the process definition view.
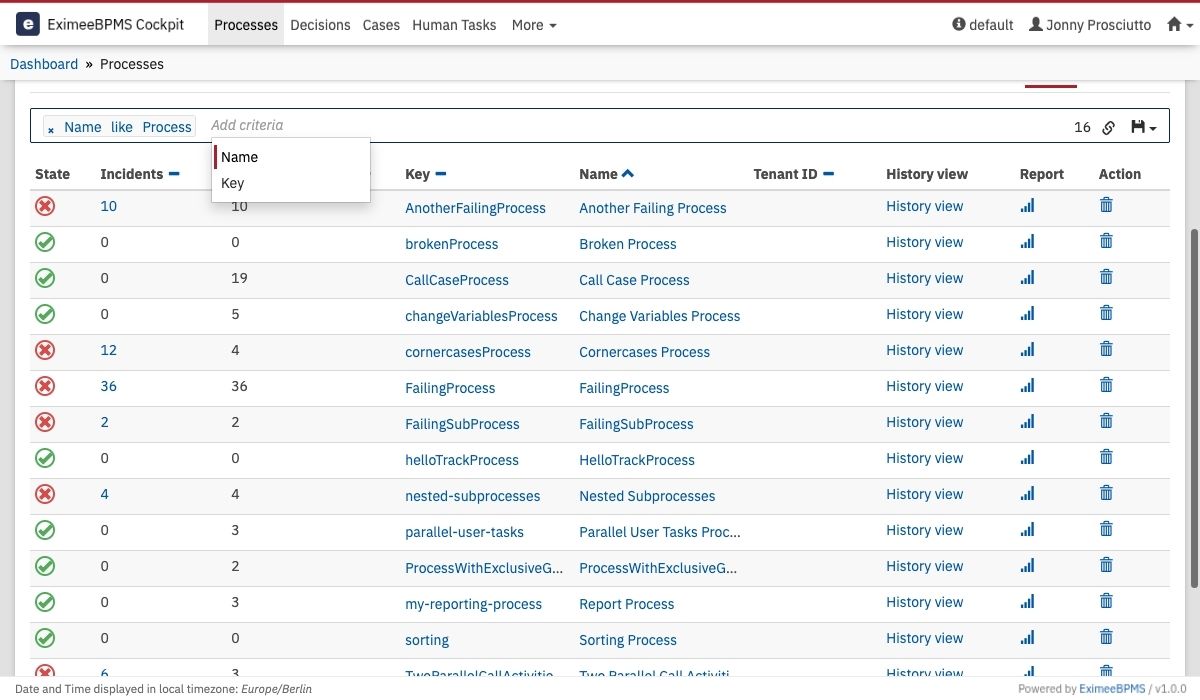
With the search component above the table, you can search for deployed processes by their name or key. To do so, click in the search box and select the property. Both of these search properties support the ‘like’ operator, which allows searching for process definitions where the entered value is a substring of the property value.
Furthermore, you can copy a link to the current search query to your clipboard by clicking on the button and you can save search queries to your local browser storage by clicking on the button and inserting a name in the drop-down menu that appears. You can then retrieve the search query by clicking on the button and selecting the chosen name in the drop-down menu.
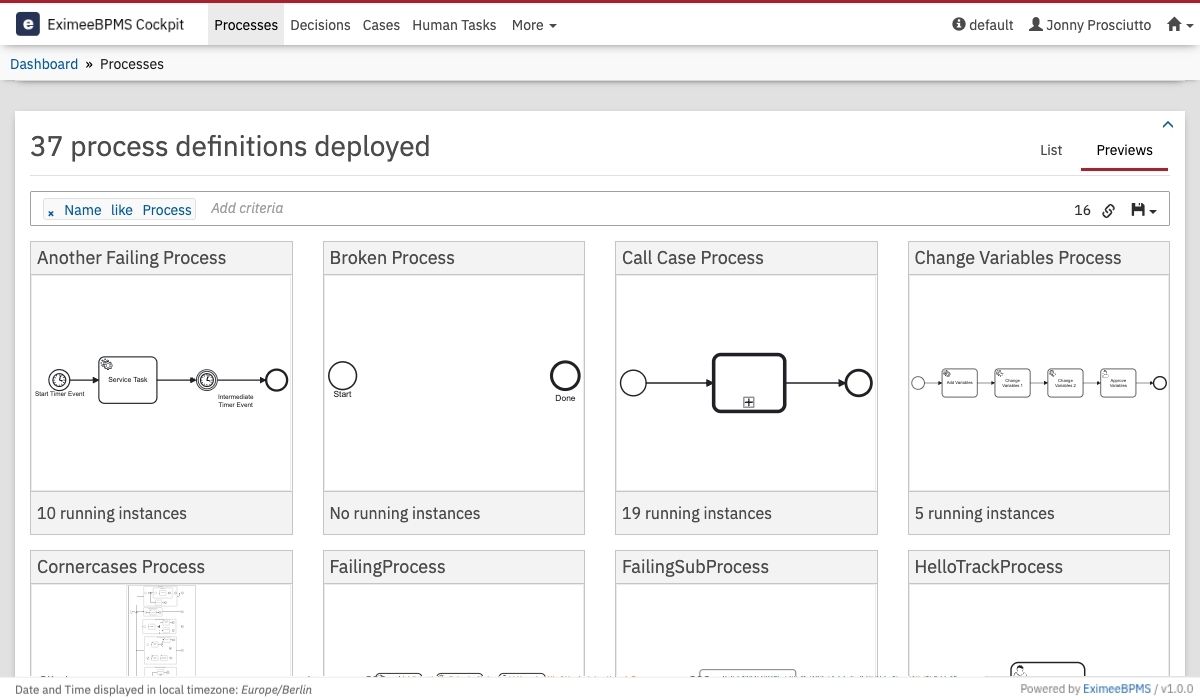
You can also switch to the preview tab which displays the rendered process model of each deployed process. Additionally, you get information about how many instances of the process are currently running and about the process state. Green and red dots signalize running and failed jobs. Click on the model to go to the process definition view.